Multivariate Data Analytics for Industry
See the failure before it happens.
Transition from reactive decisions to data-driven management. Our technology, based on multivariate data analysis (MDA), identifies hidden anomalies before failure, reduces downtime, and lowers maintenance costs.
The manifesto
Reactive is over
Run-to-failure and calendar-based maintenance burn budget and uptime. We replace guesswork with continuous multivariate surveillance of your process.
Normal is enough
An archive of normal operation is all we need. No failure data, no years of labelling — the standard of healthy behavior is learned from what you already have.
No black boxes
Every alarm comes with an explanation. Load vectors show exactly which parameter deviated, by how much, and what to do about it.
Solution 01 — Connectivity & IT-Infrastructure
Connect your equipment. Unify your data.
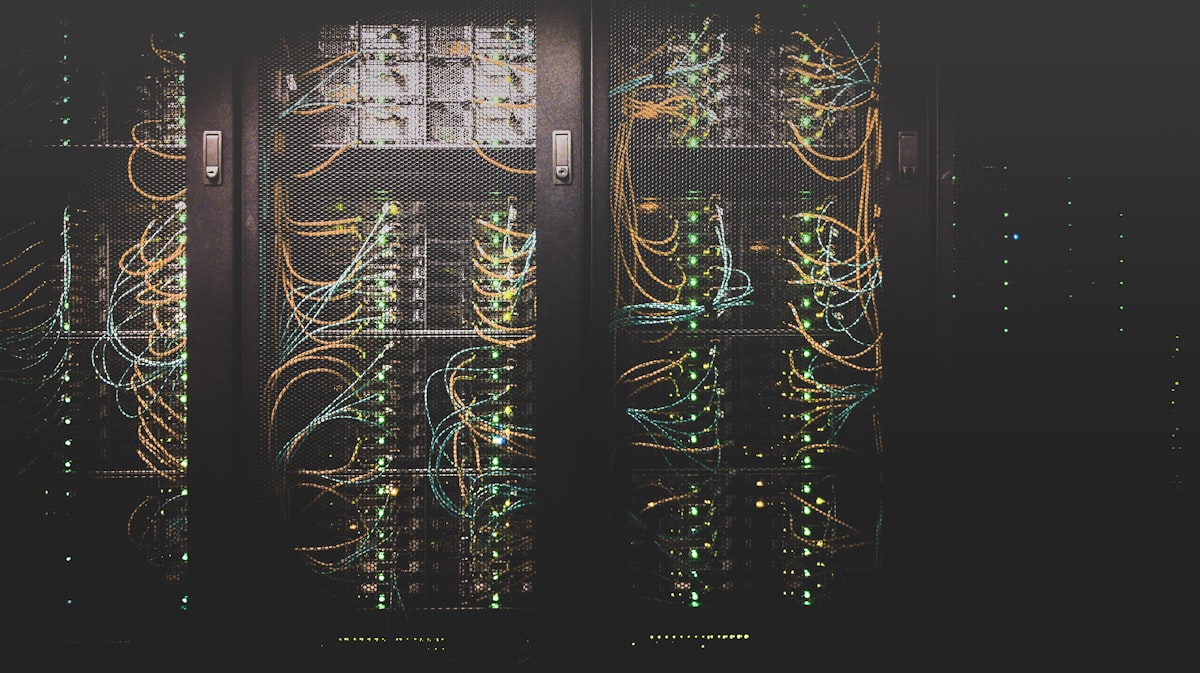
We transform disparate data sources — SCADA, ICS, PLC, sensors — into a unified, reliable, and scalable digital network. You gain the foundation for predictive analytics, quality control, and production optimization.
What is included in the service?
Technical audit
Survey of existing equipment, controllers, SCADA systems and networks. Evaluation of data quality, polling frequency, and gaps. Identifying bottlenecks hindering digitalization.
// Result: Report with a roadmap and technical specifications
Deployment of the data collection system
Installation of industrial gateways and edge agents. Configuring adapters for OPC UA, Modbus TCP, MQTT, Siemens S7. Streaming data through message brokers (Kafka / NATS).
// Result: Uninterrupted data collection in real time
Creating time series databases
Deployment of a specialized database on the customer's premises (on-premise) or in the cloud. Automatic data cleanup, synchronization, and quality control.
// Result: A single, structured repository for historical and current data
Integration with existing systems
Connection to SCADA (WinCC, FactoryTalk, MasterSCADA, etc.). Integration with MES and ERP via REST API.
// Result: Digital circuit "equipment → analytics → control"
Ensuring reliability and safety
On-premise deployment within the customer's network for critical information infrastructure (CII) and pharmaceuticals. Ability to work on Russian operating systems. Redundancy and system health monitoring.
// Result: Secure and resilient infrastructure
Ready to build a robust IT infrastructure for digital transformation? Request a free initial audit — we'll assess your current status and highlight potential for optimization.
Request it nowSolution 02 — Predictive Analytics
Predict equipment failures. Optimize maintenance schedules.
Transition from reactive decisions to data-driven management. Our technology, based on multivariate data analysis (MDA), identifies hidden anomalies before failure, reduces downtime, and lowers maintenance costs.

How our technology works
Data collection and preparation
We connect to your sensors, controllers, and SCADA via OPC UA, Modbus, and MQTT. We accumulate historical data — an archive of normal operation is sufficient; data on failures is not required.
Building a "digital shadow"
Multivariate statistics compress hundreds of parameters into a few key components. We establish the standard — the "golden batch" of normal equipment behavior.
Online monitoring and anomaly detection
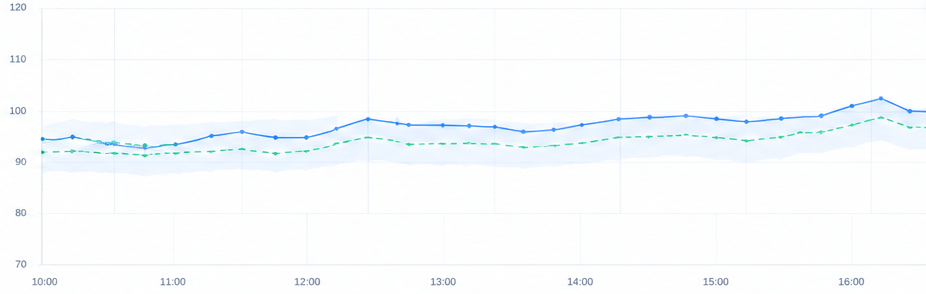
The system compares the current state with the standard in real time and flags any deviation. The prediction is generated before the critical failure.
Interpreting the causes — no black boxes
Load vectors show which parameters deviated and by how much. You receive answers like: "Thermocouple #3 in the heating zone is drifting +7°C from the norm; manifold pressure has dropped by 5%."
Making decisions
Calibrate the sensor, replace the heating element, clean the pipeline, edit process parameters. Plan repairs in advance, at a convenient time, without interrupting production.
Results for the client — numbers from the pilots
Want to predict failures instead of putting out fires? Order a free analysis of your data in just one day — we'll show you what hidden anomalies are already present in your production and what economic impact they can deliver.
Request it nowSolution 03 — Process Optimization
Identify bottlenecks. Uncover hidden inefficiencies.
We transform the chaos of production data into precise instructions for improving efficiency. Multivariate analysis uncovers hidden relationships between parameters, identifies root causes of losses, and optimizes processes without capital expenditures.
How our technology works
Data collection and integration
We connect to your sources: APCS, SCADA, MES, ERP. We collect data on process parameters (X) and product characteristics (Y).
Multivariate modeling
We build a model based on PLS regression — a mathematical relationship between input (X) and output (Y). Hundreds of parameters condense into a few key factors that explain product quality.
Identifying bottlenecks
We analyze variable contributions — which parameters influence the result and how much. We compare identical units to find behavioral differences, and cluster batches by deviation type.
Formulating recommendations
We answer the technologist's main question: "How do we configure X to get the best Y?" You receive specific, proven recommendations for changing parameters.
Implementation and control
After the changes, we keep monitoring and record the achieved effect. Control charts maintain the process in the optimal zone.
Do you want to see the hidden reserves of your production? Order an express analysis of a single process — in 1–2 weeks we'll build a model, identify key influencing factors, and provide initial recommendations for optimization.
Request it nowSolution 04 — Quality Control
Consistent quality. Batch after batch.
Move from spot product quality checks to continuous, real-time quality monitoring. Our technology compares the current process to a "gold standard" and prevents deviations before they lead to defects. Quality becomes predictable, not an afterthought.

How our technology works
Formation of the "golden standard"
Together with your technologists, we select the batches with the best quality. From historical data we construct a multidimensional profile of the ideal process (PCA method) and define control limits — the zone in which the process is considered stable.
Online comparison with the standard
The system receives data from the sensors of each new batch in real time, compares the current multidimensional state vector with the golden standard, and flags any deviation.
Detecting deviations
When control limits are exceeded, the system generates an early warning. The deviation may be imperceptible for individual sensors, but is obvious in multidimensional space.
Deciphering the cause
Contribution vectors show which parameters deviated from the standard and by how much. The technologist receives the answer: "The temperature in zone 2 is 5°C higher, the pressure in the reactor is 0.3 bar lower."
Making a decision
We correct the process immediately, preventing defects. Result: consistent quality from batch to batch.
Do you want to control quality in real time, rather than checking it after the fact? Order an analysis of three "bad" and three "good" batches — in just one week we'll show you which parameters truly distinguish defective goods from the norm, and build the first version of a "golden standard."
Request it nowSolution 05 — DFOS Data Analytics
Turn years of fiber optic monitoring archives into actionable insight.
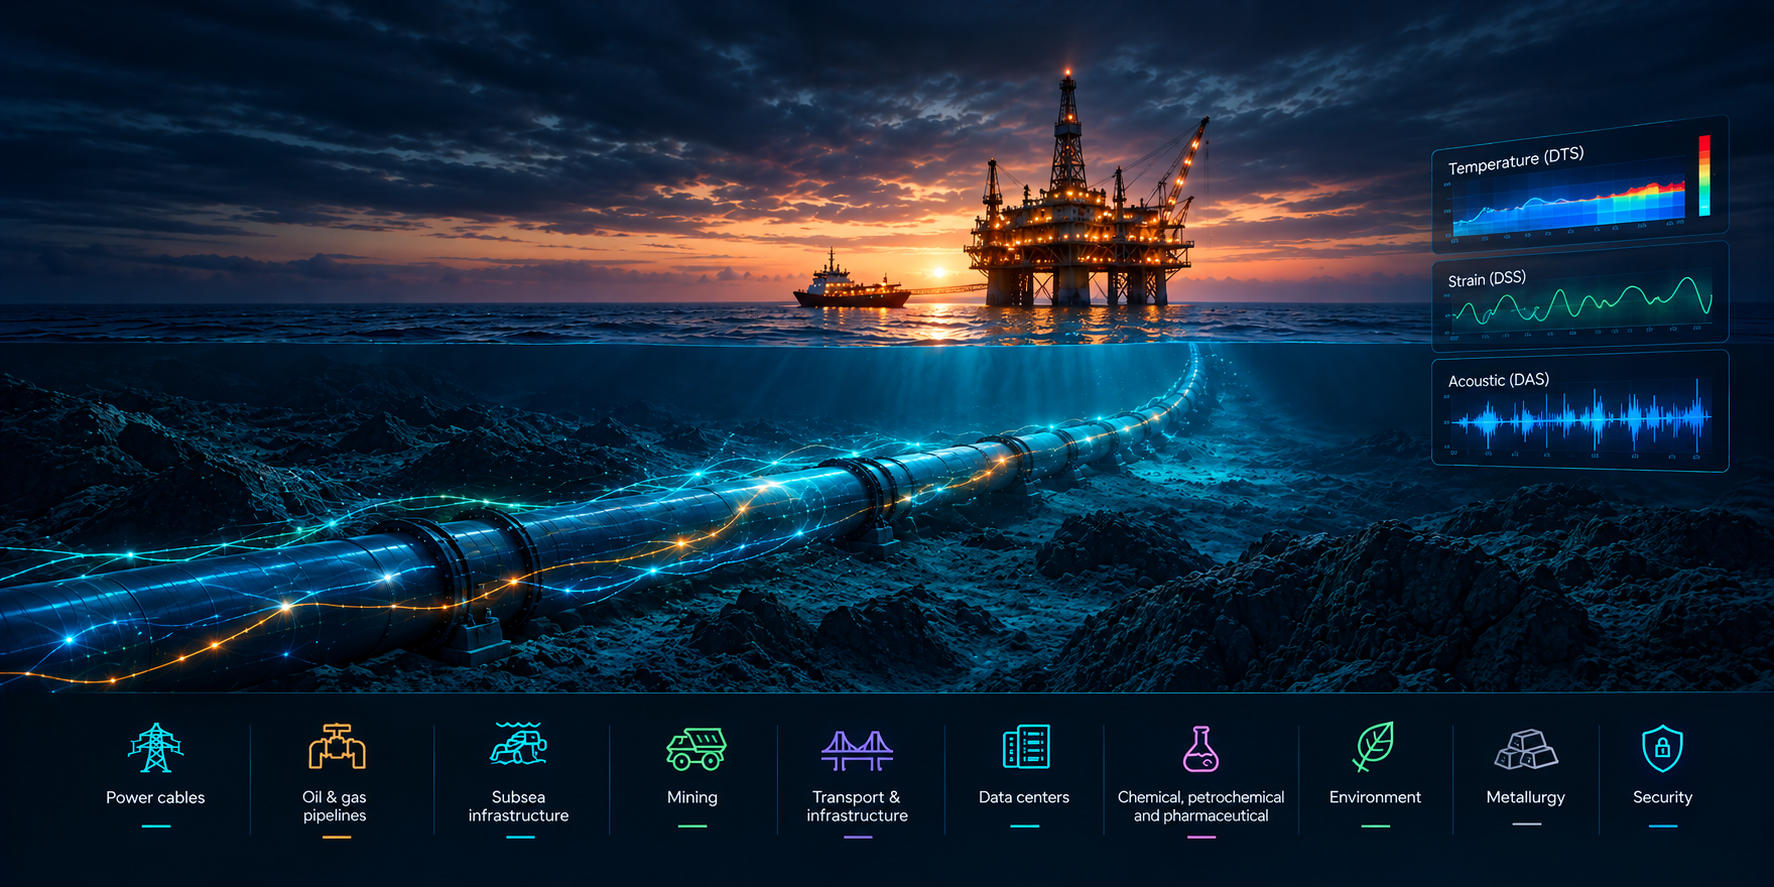
Your DTS, DSS and DAS systems have been collecting data for years. Vendor software handles live monitoring — but says nothing about what happened last month, last year, or what would happen in the future. We apply multivariate data analysis (MDA) to jointly process temperature, strain and acoustic records — and reveal hidden anomalies invisible when each channel is analyzed separately.
How our technology works
Archive ingestion and cataloging
We accept accumulated DTS, DSS, DAS and RTTR archives in any common format — HDF5, TDMS, Parquet, CSV, vendor exports. The system identifies parameters (length, spatial resolution, sampling rate, units), validates quality, and files each dataset into a unified catalog linked to your asset hierarchy.
// Result: Full inventory of what you have, and whether it is fit for analysis
Building a unified multivariate state vector
The fiber is not just a thermometer or a microphone — it is one distributed sensor. We merge DTS profiles, DSS profiles and DAS-derived features into a single multidimensional description of the trace at every moment in time. This is the foundation of multivariate analysis.
// Result: One digital shadow of the entire trace, not thousands of separate charts
PCA/PLS modeling and anomaly detection
We build a PCA/PLS model of healthy behavior from historical data. Every new observation is checked against the control limits. Anomalies are flagged — including deviations invisible in any single channel.
// Result: Hidden anomalies detected without failure history, using only normal operation archives
Interpreting the causes — no black boxes
Contribution plots show exactly which modality — temperature, strain, or acoustics — and which section of the trace contributed to the deviation. You get answers like: "Temperature contribution 40%, acoustics 45%, strain 15%, section 3,450 m."
// Result: An instruction an engineer can act on, not a score from a black box
Retrospective analysis and reporting
We reconstruct the timeline of past events, build baseline temperature and strain profiles, recompute RTTR with DSS correction, classify acoustic events, and prepare formal reports. Results are delivered through interactive views (heatmap, waterfall, spectrograms, contribution plots) and machine-readable API.
// Result: Reproducible reporting for engineering, regulatory and insurance purposes
Use cases
Show us a sample of your DTS, DSS or DAS archive. We will run a pilot on a single trace, build a multivariate model, and show what your data already knows about your infrastructure — before it fails.
Request it nowWhy MDA
Chaos in. Instructions out.
Anomalies before failure
Deviations are flagged while there is still time to act — weeks, not minutes.
Less downtime
Plan repairs at a convenient time, without interrupting production. Unplanned stops become scheduled tasks.
Lower maintenance costs
Calibrate, replace, clean — only where the data says so. No more blanket part swaps and over-maintenance.
Explainable answers
Not a score from a black box: "Thermocouple #3 is drifting +7°C from the norm" — an instruction an engineer can execute.
Get started
Your archive of normal operation is enough to begin.
Tell us about your process. We will show you what your data already knows about your equipment — before it fails.
// No failure history required
// Connects to OPC UA, Modbus, MQTT
// Pilot on one unit, scale to the plant